Using an LLM to optimise a Cloud Build pipeline
Manual Cloud Build deploys of this site took about six minutes. An LLM read the build log, I shipped a chain of small fixes, and typical runs are now around two.
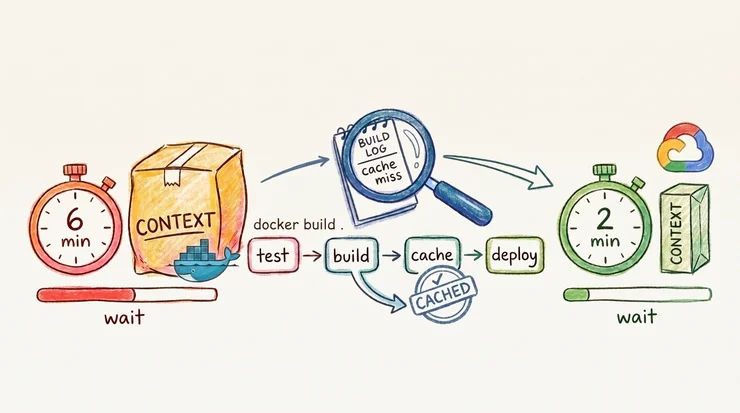
Google Cloud Build is how this site ships: an Astro SSR app on Cloud Run with static assets in Google Cloud Storage, deployed manually. The Cloud Build pipeline was not broken. It just took about six minutes every time, including when I had only changed a blog post or a YAML file. I wanted to see whether pasting its build log into an LLM would surface the waste faster than I would on my own.
Contents
- A Cloud Build pipeline that already worked
- Read the Cloud Build log with an LLM
- Fixes that survived editing
- Results
- References
A Cloud Build pipeline that already worked
This was not greenfield CI/CD. By the time I started optimising, the flow was already sensible:
A manual Cloud Build trigger on main. Unit tests gate everything. Asset sync and the Docker image build run in parallel after that. Deploy waits for both.
I left that structure alone. I was only cutting wasted time inside the steps, not dropping the tests. Same approach as when I turned a month of request logs into Cloudflare WAF rules on another project: the model helps you sort the noise, but you still have to supervise it.
Read the Cloud Build log with an LLM
I pasted a slow Cloud Build log into the model and asked it to act like a performance engineer: break the wall clock down by step, flag repeated work, and explain the cache misses.
It came back with a time budget that held up once I checked the lines it was quoting:
| Phase | Approx. time (slow build) |
|---|---|
| FETCHSOURCE + step image pulls | ~15 s |
unit-tests |
~50 s |
build-image |
~95 s |
push-image (separate step) |
~15 s |
deploy |
~40 s |
| Total | ~3m40s – 6 min |
Early deploys were closer to six minutes. After a first round of fixes I was still seeing ~3m40 on some runs — especially when the lockfile had not changed but Docker rebuilt the dependencies anyway. Three problems stood out.
Bloated Docker context. Unit tests leave node_modules/ on the shared Cloud Build workspace. My .dockerignore barely excluded anything, so the image build tarred hundreds of megabytes of junk before running its own install inside the container.
Work done twice. Later steps recompiled scripts the unit tests had already produced, and the deploy pulled the full Cloud SDK image to run a single gcloud command.
A cache that missed for the wrong reasons. A floating Node base-image tag had moved upstream, so every layer rebuilt cold despite an unchanged lockfile. The image step also exported a local tarball and pushed it in a separate step — another round trip for the same layers.
A few redacted lines from a slow run, so you can see the flavour:
#7 transferring context: 587.42MB
#12 [build 4/6] RUN npm ci …
#12 DONE 37.2s
Downloaded newer image for node:24-alpine
I could have found all of this by hand. The LLM just made the first pass faster: one sitting with the log, a ranked list of suspects, and enough vocabulary to know where to look next.
Fixes that survived editing
I did not ship the first draft. Bigger worker pools, running tests in parallel with the image build — both rejected on purpose. What I kept was four changes:
-
Stop shipping junk to Docker. An expanded
.dockerignorekeeps workspace artefacts out of the build context. Context dropped from hundreds of megabytes to under one. -
Stop building twice. Reuse the scripts the test step already compiled instead of recompiling them in later steps. Deploy with Cloud Build’s slim
gcloudbuilder instead of the full Cloud SDK image. -
Make the cache actually cache. Pin the Node base image by digest so an upstream retag cannot silently bust every layer. Push straight from BuildKit with a registry cache and drop the separate push step.
-
Skip steps when nothing changed. Fingerprint the static assets and skip GCS sync on code-only deploys. Checksum-based
gcloud storage rsyncmeans checkout timestamps do not re-upload unchanged files.
While the Dockerfile was open I also shrank the runtime image — smaller compressed size, much faster cold start on Cloud Run. A runtime win rather than a CI win, but it was the same editing pass.
Deliberate non-goals: automatic deploy on every push (still manual), caching node_modules across builds in GCS, and paying for a high-CPU worker pool.
Results
Once the chain landed and a couple of deploys had warmed the registry cache, a typical code-only Cloud Build run with a stable lockfile settled around two minutes, down from about six.
| Metric | Before | After |
|---|---|---|
| Typical deploy (code-only, stable lockfile) | ~6 min | ~2 min |
| Docker build context | 587 MB | under 1 MB |
| GCS asset sync on code-only deploy | full rsync | skipped when fingerprint matches |
| Production image (compressed) | 235 MB | 163 MB |
Cloud Run cold start (first GET /) |
~29 s | ~159 ms |
Later logs showed the shape I wanted: a tiny build context, CACHED on the expensive install when the lockfile was stable, and asset sync exiting early when there was nothing new to upload.
If there is a lesson here, it is embarrassingly boring: read the build log. Mine had been pointing at the wasted minutes all along; nobody was listening. The model did the listening — with more patience than I have after a full day of work — and handed me a list worth arguing with. So I argued. Half the ideas went in the bin, the rest went into the yaml, and real deploys told me whether the numbers were true. Six minutes down to two will not change anyone’s life, but I deploy this site in the evenings, and the evenings are mine.